Google Analytics

Sometimes abbreviated GA, "Google Analytics" is a tracking tool developed by Google, to collect and provide valuable information about websites. It is a powerful web analytics application that provides information to both websites and mobile applications about their performance and…
In the digital and Internet age, generating traffic and converting leads is a real marketing challenge that many are facing. To meet this challenge, it is necessary to be able to track and exploit data related to the activity of one’s website.
With its numerous analytics reports, this is where Google Analytics comes into play as the main solution to access essential and actionable data of a website.
In order to help you have a better understanding of Google Analytics and its many features, this mini guide answers the following questions in a very concrete way:
- What is the Google Analytics tool?
- What are the features of GA?
- How is Google Analytics useful for businesses?
- How to create, configure and use Google Analytics?
- What are the different GA reports?
Because it is crucial that you have a clear and precise knowledge of this tool, which is essential for the follow-up and success of your digital marketingi invite you to read this article carefully.
Let’s get started!
Chapter 1: Introduction to Google Analytics – The basics of the tool
Taken at face value, Google Analytics can seem confusing, intimidating and extremely complicated. Rest assured, it is not
In this first chapter, I will introduce you to the basics of the tool, so that you can use it in the best possible way to optimize your website’s referencing and increase your sales.
1.1. The Google Analytics tool: What is it?
Let’s take a closer look at Google Analytics to understand what it is. That said, before going any further, here is a clear definition of GA.
1.1.1. Definition of Google Analytics
Google Analytics is a tracking platform and a superb analytics tool that gives you a meticulously detailed overview of your website or mobile app’s performance

This fabulous product from Google collects, among other things, statistical data on how users find and interact with your site. Once collected, the relevant information is recorded and made actionable for you through interactive and easy-to-read reports.

GA reports are used daily by sEOs to facilitate the best possiblesEO optimization optimization of your website
Today, Google Analytics combines many features, some of which are basic and easy to use even for most Internet users. On the other hand, other features are a bit more complex and require the expertise of professionals such as Twaino.
1.1.2. A brief summary of the history of Google Analytics
Data related to the functioning of websites have not always been so easy to access, simple and pleasant to read
Originally, to know what kind of traffic your website was receiving, you had to consult the server log. This log provided a certain amount of information for each action performed on the website
Although valuable, the data that is provided is still complex and therefore difficult to understand. In order to make things a little easier, companies decided to start compiling the log files in order to create reports from the available data.
It is in this context that a company called Urchin Software Corporation stood out from the crowd because of the quality and popularity of its log file reports

Source semji.com
Having caught the eye of the famous Mountain View firm, Urchin Software Corporation was acquired in april 2005 by Google
It is thus from the product Urchin on Demand that the process of creating and enhancing Google Analytics began.
At the beginning, the GA platform was only a simple visualization tool. It simplified access to log file data that became a little easier to understand

Source moz.com
Although it looks like today’s platform, Google Analytics provided much less data back then.
Over the years, Google has made it a priority to improve its product. The most recent revision of the platform was released in october 2020 Google Analytics 4. GA4 is a new approach to web + app properties and it brings all the data together in one stream
The machine learning side and the predictive analytics feature offered by the platform have also been improved on all versions of the product.
1.1.3. What are the different versions of Google Analytics?
There are two versions of Google’s main analytics tool. The first version, Google Analytics, is the subject of this content

GA is a free tool, accessible online by all cybernauts and ideal for individuals as well as small and medium-sized enterprises (SMEs). Unlike GA, the 360 version version, also known as Google Analytics Premium, is not free and is more suitable for large companies.
Indeed, the use of Google Analytics 360 is invoiced monthly. This premium version of Google Analytics makes it easier for website operators to:
- Data integration with Salesforce;
- Advanced analysis of performance and attribution models;
- Access to unlimited, unsplit data;
- Leverage more dimensions, views, or metrics per property;
- And the use of many other custom features.
With the 360 subscription, you also get access to dedicated support and your own account manager.
Opting for Google Analytics 360 is clearly an excellent investment for companies with a large budget.
On the other hand, the free version of the tool offers what is necessary to cover all the needs that a small or medium-sized company might have in terms of collecting and analyzing multiple data on its website
In fact, Google Analytics integrates perfectly with many advertising platforms and other marketing products from Google including
- Google Tag Manager ;
- Google Ads ;
- Google Adsense ;
- Google Optimize ;
- Google Search Console ;
- Google Data Studio ;
- Etc
This makes GA the first choice for data collection and analysis for anyone who is an avid user of Google products and services.
But more concretely, Google Analytics was developed for what kind of people?
1.2) Who is Google Analytics for?
It’s very simple, any individual, company or organization with any kind of online activity is able to use Google Analytics.
In order to benefit from GA services, you just need to have a Google account. From there, you will be able to implement, configure, maintain and use Google Analytics as it should be.
Depending on which version of the software you opt for, you will be able to identify the data you need to best grow your online presence and activities.

In other words, Google Analytics is for you if you are one of those who generally want to
- Measure and analyze the performance of their digital brand to identify what works and what doesn’t;
- Find and test solutions for solving the problems present in your website in order to improve it;
- And so on
In the same vein, the GA tool provides clear answers to various questions that website operators often ask themselves, such as
- How many visitors are coming to the website?
- What attracts them to the website or what is the path of these visitors to the website?
- What devices are these visitors connecting with and from where?
- How many of these users are from different partners?
- What is the proportion of customers who made a purchase as a result of an emailing?
- How many users took the time to download the white paper?
- What are the main products and services that work best with the target audience?
- And so on.
It is safe to say that Google Analytics is a decisive weapon for anyone struggling to make their website even more successful.
1.3. How does Google Analytics work?
The role of Google Analytics is now clear and known to everyone, but how does GA go about performing its functions?
In order to get data from your website into Google Analytics, you must first place the GA tracking tag on your website. After properly adding this tracking code to your website (don’t worry, we’ll talk about it in later chapters), GA will start collecting data
All the information about your website’s online activity can then be transformed into an incredible mass of data that is perfectly structured and usable. This data is analyzed, classified and grouped in reports composed of metrics and dimensions
This is how you will receive, for example, detailed data on the traffic of your website. This allows you to track your users in relation to
- Their geographical location
- Their interests
- The devices they use to access your website;
- Their waiting time;
- Their bounce rate ;
- Etc
You can also get data on the quality and quantity of direct and organic traffic you receive. Finally, you can see how your website is performing in terms of speed and content.
All of this is valuable information that Google Analytics provides about your website and your audience. Is this why GA is considered a must in the world of digital marketing ?
Chapter 2: The major advantages of Google Analytics: Why is it essential?
Google Analytics is essential foroptimization of your natural referencing and for the success of your webmarketing strategy. Why?
This is what we will take the time to discover in this chapter.
2.1 Google Analytics – A free and very useful tool
2.1.1. Google Analytics: An accessible and practical platform
The Google Analytics platform allows you to measure the performance of your website for free. Being free, the basic functionalities offered are available and accessible to all
This free service and the diversity of its features have made GA the most used web analytics tool on the market, for individuals as well as for large and small businesses.
And for good reason, the role of Google Analytics in the strategic decision making process is clearly crucial.
Always faithful to its intention to provide its users with the best in terms ofUXto its users, Google provides them withcountless resources to make using Google Analytics easier
In addition, the growing community of Google Analytics users is sharing information and tips along the same lines. This increases the accessibility of the GA platform for users, regardless of their skill level

In short, the reason why Google Analytics is so popular and adored is largely because it is free, open source and easy to access.
2.1.2. The importance of Google Analytics insights
Google Analytics is an asset for certified analystsgoogle Analytics is an asset for certified analysts, as it allows them to perform both basic and advanced analysis. The wealth of information it offers makes it one of the best data analysis tools in its class.
The valuable data provided by Google Analytics clearly shows the tastes and habits of your target audience in relation to your website. This allows you to adapt your services and content to the needs and desires of your audience.

It’s a bit like the difference between a ready-to-wear and a fashion designer. With ready-to-wear, the customer only has the choice between the available clothing offers. He has no influence on the choice of fabrics or on the shape of the garment
On the other hand, a fashion designer will go and inquire about the tastes, the physiognomy and the requirements of the consumer in order to make him the suit that he wants and that is adapted to his specific needs.
We immediately understand the importance of Google Analytics. It is thanks to it that you will be able to see which of your contents are appreciated by your audience, so that you can repeat your success.
2.1.3. Google Analytics for search engine marketing professionals
Who wouldn’t want to receive information about their website from the largest search engine in the history of the Internet? For SEM (Search Engine Marketing) specialists, the big part of the job is to do everything possible to please Google

With Google Analytics, you have free access to a platform that can show certain data that Google takes into account about your websites. It is clearly a godsend for the strategic planning of various referencing campaigns.
Referring to Google Analytics figures for website optimization is therefore choosing a strategy based on real data rather than relying entirely on intuition.
2.2 Google Analytics: Why use it?
There are many reasons why it is recommended to use Google Analytics. Indeed, GA remains the most interesting web analytics tool on the market, as it allows to explain and achieve many things. I will quote some of them here.
2.2.1. Consult essential information about your online presence
GA’s platform has been designed to make it comfortable and obvious to consult the information. All essential data is clearly displayed on the platform’s homepage as soon as you log in to Google Analytics.

You have direct access to the main data and can instantly follow the evolution of the data through the red and green color code
L’user interface of the platform is organized in such a way as to make it easy for users to access all the features that Google Analytics offers
You have the freedom to create a personalized dashboard with widgets of your choice. This custom interface allows you to:
- Browse and customize Google Analytics reports;
- Save your changes to the GA report configuration;
- Access the GA setting;
- View and control the timing of your data;
- Discover data from other websites associated with your GA account;
- Etc
Google Analytics is a prime example of what a good user experience.
2.2.2. Know and understand your audience
The Google Analytics software allows you to collect the maximum amount of information necessary to understand the characteristics and behavior of your audience
2.2.2.1. Demographic, geographic and logistical data of your visitors
This includes the age, gender, geographical location, language, type of electronic medium, etc. of the visitors to your website.
All this data is accessible from the visitor menu. They allow you, for example, to know the average length of visit of the Internet users and the bounce rate of visitors from a certain country

You are also aware of the conversion rate (number of leads transformed into actual customers) according to the geographical distribution of your users.
By providing you with all this important data, Google Analytics allows you to define an ideal target for each of the messages you will have to convey to the public
Furthermore, GA helps you determine and test various potential improvement alternatives that can be implemented on your website to increase the quantity and quality of your traffic.
For example, if the proportion of Internet users visiting your website from a mobile device (smartphone or tablet) is as high as the trend would suggest, it will be crucial that your website is Mobile Friendly.
Being able to access such data is an undeniable advantage that allows you to intelligently strengthen your online presence, improve your services and reach more people.

And for good reason, Google Analytics allows you to check, for example, if the modification of your theme you gain or lose visitors on mobile
You can also use this data to make crucial decisions such as:
- Schedule your publications for a given time rather than another ;
- Translating your website into a specific language;
- Modifying your speech according to the age, gender and interests of your audience;
- Etc.
2.2.2.2. The characteristics and evolution of the traffic on your website
Thanks to Google Analytics, you are able to follow the traffic of your website in time
For example, you can follow live the web pages that your visitors are browsing at the moment. Although very fun and friendly, the use of this feature is only really useful at certain times.
For example, during the launch of a new website, an advertisement or a product, seeing the traffic on your website for a few minutes can be a real mine of information.
On the other hand, it is not relevant to follow in real time and daily the number of visitors to see an increase in your traffic at 10:05 am, but a decrease at 10:09 am, your analysis will most likely be distorted
Google’s training on Analytics actually advises to always prefer post-hoc analysis and comparisons over periods of several days.
In addition to real-time tracking, GA also allows you to measure and analyze the origin of your traffic. In other words, it allows you to identify the different channels through which your visitors come and their respective proportions

The main sources of traffic are
- The direct traffic where Internet users enter directly the address of your site in their web browser;
- The organic searches where visitors follow an unsponsored link in the SERP ;
- The paid searches where visitors start from sponsored ads;
- The other websites where visitors go through your backlinks ;
- The social networks from your publications ;
- The emailing campaigns ;
- Etc.
This information is crucial to evaluate the effectiveness of your online marketing campaigns.
For example, let’s say Google Analytics tells you that producing content to promote your business on social networks consumes 35% of your budget. But at the same time, it shows you that social networks contribute only 7% of the overall traffic to your website
It’s clearly time for you to redistribute your resources to more effective and relevant channels such as organic search throughsEO optimization optimization of your website.

2.2.2.3. The behavior of Internet users on your website
It goes without saying that your website’s audience is made up of a diversity of Internet users, each with different habits
This audience gathers several handfuls of individuals more or less sensitive to your message, to your products and services, with consumption and navigation habits that are specific to them. In the world of marketing, this is called a “Segment”.
Google Analytics gives you the possibility to isolate the statistics contained in its reports according to each segment of your audience
You can decide to consult all the data recorded by GA or just the data related to a specific segment such as the mobile audience or the audience from search engine audience.
Moreover, you are free to create your own segments and follow the statistics of your audience according to your criteria.

With Google Analytics, you will be able to specify a certain amount of relevant information on how users interact with your site.
You can thus identify the different keywords searched by visitors on your website by analyzing the queries made by the users. By doing so, you will be able to have a fairly accurate idea of the products and services that users are interested in.
On the other hand, you can also know the favorite clicks of your visitors. Indeed, with the In-page Analytics feature, you are perfectly able to study the behavior of your visitors on your web pages in great detail.

This way, you can evaluate the efficiency of your website’s layout, design and your CTA (Call To Action)
To go further, Google Analytics allows you to measure the rate of visitors who have initiated and then stopped the purchase process on your e-commerce site
You are then able to understand the “why” of the cart abandonment rate values on your platform. The value of this point is enormous, since the elements that systematically cause the departure from the site will be identified

This is a valuable indicator that helps you to evaluate the ergonomics and efficiency of the shopping path proposed on your website.
2.2.3. Measuring and monitoring the performance of your website
When you think about it, the real role of Google Analytics is to keep website operators informed of everything that is happening on their website. Thanks to this information, operators are able to :
- Explain increases and decreases in their traffic;
- Evaluate the evolution of their blog over two given periods;
- Evaluate the quality and success of their content ;
- Estimate the loyalty rate of their visitors;
- D’improve the technical aspect of their website ;
- Determine the reach of their advertising campaigns;
- To monitor the SEO of their website with Google Search Console ;
- Create automated alerts
- And much more.
So to speak, Google Analytics provides you with a series ofkey performance indicators or KPIs to help you make the right decisions to improve your company’s online activity.
There are many reasons why you should use Google Analytics and most of them you know by now. However, knowing what GA is for without knowing how to use it is like being in the front line with a weapon you don’t know how to handle
For this very reason, I will explain in the next chapter how to get the most out of Google Analytics.
Chapter 3: How to understand and use Google Analytics at best?
Before getting into the heart of what seems to be a tutorial on how to use Google Analytics, let’s agree on our vocabulary.
3.1. The key notions necessary for a good Google Analytics experience
To be able to understand Google Analytics, it is essential that you understand the basic parameters that govern the presentation of data in the software.
3.1.1. Google Analytics Dimensions and Metrics
These are the fundamental parameters of Google Analytics for the analysis and calculation of sEO performance performance of your website.
3.1.1.1. Metrics or statistics
These are quantitative variables. In other words, all data that are measurable through numbers are metrics. For example, we can quote:
- The average number of visitors who consulted your website in one day;
- The number of purchases made
- The value of successful conversions;
- The average time spent on the website;
- Etc
In GA reports these metrics are often presented in columns.

3.1.1.2. The dimensions
These are qualitative variables. They are data based on non-calculated evaluations that are used to differentiate visitors (name, location, etc.) among others. This attribute-based user data is used to characterize your website sessions
Simply put, dimensions represent how metrics can be segmented. In particular, keep in mind the word “by” :
- The average number of visitors per type of source;
- The average time spent on the website by landing page ;
- The number of successful conversions per device type (mobile, desktop);
- Etc
These dimensions are usually shown in rows on Google Analytics reports.
The dimensions and metrics are also customizable according to your needs.
3.1.2. Some other technical concepts inherent to GA that you should keep in mind
- Sessions corresponds to the number of times the website has been visited or the duration during which the user has remained active on the site.
- Cookies a file embedded on the user’s device that identifies and tracks the user’s entire journey and interaction with your digital brand.
- Organic traffic it refers to the unpaid traffic coming from the SERPas opposed to traffic obtained through paid advertisements.
- Source this is the online origin of a session, the point of origin of visitors.
- Predictive analysis this is the estimation of future data based on previous trends.
- Conversion rate this is the percentage of sessions that result in a conversion. It can be calculated as the ratio of the number of conversions to the number of sessions.
Now that everyone understands the main jargon inherent in using Google Analytics, let’s see how the software looks.
3.2. The hierarchy of Google Analytics – the tool’s coordination levels
As you know, in order to use Google Analytics you need to have a valid Google account. Well, that’s not all.
Indeed, once your Google account is set up, it does not mean that you have automatic access to GA. You must first sign up for the Google Analytics platform
However, as a prelude to this series of sign-ups, it’s crucial that you understand and retain the tool’s configuration, especially its hierarchical structure.
Here is how the working levels of the Google Analytics platform look like.

Let’s take a closer look at each of these sections of the GA hierarchy.
3.2.1. Organizations
The organization is at the top of the hierarchy and represents the company. Being the highest level, it can encompass multiple Google Analytics accounts for several different products.
Organizations are best suited and mainly recommended for large companies, otherwise they remain optional.
3.2.2. Accounts
Unlike organizations, accounts are mandatory. Using Google Analytics requires at least one account, if not several. And for good reason, the account represents the real access point to GA.
One or more accounts can be held by one and the same organization and an account can be linked to the management of one or more properties. Each operator is effectively free to manage the affiliation between their accounts and properties as they see fit.
However, it should be kept in mind that each account can only contain up to 50 properties.
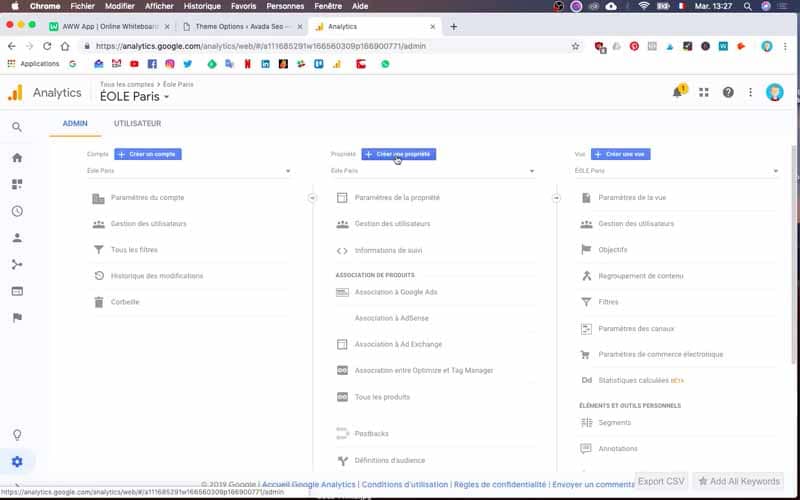
The following interface is an example of an account associated with 3 properties with 4 views each.

Having said that, be aware that a GA account is not synonymous with a user account. The proof is that the head of a company can connect to his company’s Google Analytics account using his Google email credentials.
At the same time, the person responsible for technical referencing of the company’s website can also access the same account with his own Google e-mail credentials. This also applies to all the different people in the company who need to access this account.
Keep in mind that user access permissions can be assigned for an entire account, for a given property within an account or even just for a view within a property.

Depending on the use case and objectives, each company determines the structure and access permissions for Google Analytics.
3.2.3. Properties
A property can refer to a website, a mobile application or a device. All properties on which you want to collect and analyze data can be added to your GA account.
This will give you a tracking code with a specific identifier to distinguish the data corresponding to each property. In addition, each property can support up to 25 views.
3.2.4. The views
The view captures the information of a property to present it to the user in the predefined filtered format. Each property must have at least two views:
- One that is in the raw state without any formatting and that it is advisable to keep on hand for a global visualization of all data ;
- And the other with filters configured to not consider traffic coming from your company (a filter for your IP address for example), as well as crawlers and spam traffic.

Source axiz-ebusiness.com
You are free to add as many views and filters as you like. However, be careful not to delete a view unless you are completely sure, because once deleted, the data in the view becomes irretrievable forever.
That’s why it’s crucial to keep an unfiltered view of your data.
Now that we are all familiar with the basics of setting up Google Analytics, here are the different steps for using the tool.
3.3 How to use Google Analytics?
3.3.1. The practical steps of GA configuration
Here, I present you the general way to set up Google Analytics 4 for a website hosted by a CMS such as WordPress.
As specified by Google itself specifies, the configuring Analytics for CMS-hosted websites hosted websites starts with the creation of an Analytics account.
1. Sign in or create an Analytics account
Go to GA and sign in to your account

If you don’t have one yet:
- Click “Create Account” in the “Account” column on the admin page;
- Name your account
- Choose the data settings to control the data you share with Google;
- Click on “Next”.
2. Add and set up a property in your GA account
- If you followed the previous procedure, name your property; if not, first click on “Create a property” and then give it a name;
- Select the time zone and the currency of the reports then click on “Next”;
- Designate the industry category and the size of your company;

- Read and accept the GA Terms of Use and Data Processing Agreement.
3. Create a data feed
- Choose the web platform
- Enter the URL of your main website (for example, twaino.com) and a feed name;

- Enable the enhanced metrics feature;
- Click on “Get Tracking ID”.

4. Start collecting data for your property
- Copy the entire GA page tag;

- Integrate it into your website using the custom HTML functionality of Your CMS;
- Verify that the tracking code is working by viewing the real-time report ;

- Check this article on installing Google Analytics on WordPress to know exactly how to proceed with this powerful free tool.
3.3.2. Getting the most out of Google Analytics
In order to make the most of the many advantages offered by Google Analytics software, it is crucial that you perform the following operations, among others:
- Distribute user permissions for configuration changes and data interaction wisely;
- Link your GA and Google Ads accounts to better understand the impact of your various marketing campaigns on your audience;
- Meticulously configure report views to attach your GA account users to relevant data that corresponds to them;
- Always review the available dashboards, custom reports and segments;
- Etc.
Chapter 4: The main reports in Google Analytics
It’s a fact, the data available on Google Analytics is colossal. In order not to get overwhelmed by this mountain of information, it is advisable to have a general idea of the different types of GA reports and what they contain.
There are 5 types of reports on the left sidebar of Google Analytics.

These Google Analytics reports are comparable to the traditional marketing funnel.
4.1. The real-time report
As the name clearly states, this report records and displays data about users and their interactions with your property in real time. Typically, this type of report covers the last 5 minutes of activity and sometimes up to the last 30 minutes.

Although very informative, the information conveyed in this report is less powerful than the other reports.
4.2. The Hearing Report
This is the report that helps you know and understand your visitors. It provides relevant dimensions that allow you to characterize the audience of your property

It is recommended to consult it daily in order to have a fairly accurate idea of the general trend.
4.3. The acquisition report
This is the report that shows you the paths your audience is taking to access your property

This is the report to consult for the evaluation and improvement of your marketing strategy.
4.4. The behavior report
One of the most used reports is the behavior report, which shows you the path taken by Internet users on your property

It helps you identify the most popular content, the best performing pages and those that need help.
4.5. Conversion report
This is the last report. It shows if and when users convert on your property

Thanks to this type of report, you can know to what extent your property converts visitors (causes, number, frequency of conversions, etc.)
One thing to keep in mind is that this type of report only generates data if you have previously defined conversions in your objectives.
In summary
This is the end of our development on Google Analytics. You are now fully aware of the scope and added value of the GA tool for your company.
Useful, practical, informative and complete, Google Analytics remains the tool of choice for monitoring the performance of all digital properties.
You know how to use it and make the most of its valuable data to develop your online business
Don’t hesitate to share your adventures with the famous GA platform in the comments.
See you soon!

Related terms


