Infographics are proven in 2019 to be the most powerful visual content and 65% of marketers use them in their SEO strategies
And yet, marketers often stop at creating infographics and don’t worry about their SEO when it’s the most important part when it comes to getting organic traffic.
Through this guide, we discover the 5 essential steps to optimize an infographic for SEO in compliance with Google guidelines.
Why is optimizing infographics important for SEO?
The main goal of SEO is to improve a brand’s visibility and drive significant traffic to your website.
While there are multiple strategies to get closer to this goal, creating infographics appears to be one of the most effective ways to achieve it.
In fact, infographics increase site traffic by up to 12% and people remember more than 65% of the information they see visually. In addition, infographics are 30 times more likely to be read in their entirety than traditional articles.
These statistics show the need to adopt an infographic-based SEO strategy to significantly boost your visibility in the SERPs.
Infographics work for SEO for three reasons which are as follows:
Opportunities to create backlinks
Theimportance of backlinks for the SEO of a site is no longer in question. All marketers know that it is the most important aspect when it comes to improving the SEO of a site.
The sites that generate the most backlinks are the best placed in the SERPs and infographics are a new way to acquire a significant number of backlinks.

They increase link building opportunities and generate high quality backlinks without much effort
They are a winning content marketing tool because of their ability to stand out and present information in an easy-to-digest manner
Also, infographics are less common than blog posts and don’t require as much promotion before they get traction.
Infographics are easier to share
Infographics have huge potential on social media and are easily shared. The fact that infographics can be shared on these networks increases the chance of them going viral.
Internet users are fond of visual content and marketers take advantage of it to reach more people. This way, they manage to attract more traffic to their websites and increase the awareness of their brands
Infographics are attractive
It’s a given that humans are visual creatures by nature. According to Webdam quoted by Buddy Gardner, content that contains images attracts 650% more interest than content that contains only text.
Plus, with attention spans shrinking in the face of information overload these days, people really appreciate content that is easy to read and consume.
For these reasons, infographics are gaining in popularity and have the power to captivate readers to hold their attention longer.
Readers tend to be more invested in visual content and when infographics are done well, they help to create a connection with readers while increasing the amount of time they spend on a site.
5 steps to optimize an infographic
While infographics are a big hit with web users, it’s just as important to make them SEO friendly in order to rank well in Google and take advantage of organic traffic.
Fortunately, optimizing infographics isn’t just for SEO geniuses. By following these 5 steps, you’ll be able to effectively optimize your infographics and take advantage of their potential.

Do you like this image? Embed it for free on your website with Twaino.
Step 1: Find the ideal optimization keyword for your infographic
Keyword research is the foundation of SEO without which you will not be able to achieve your SEO goals. It’s an important step that involves making sure your content matches a single keyword or phrase that people are searching for.
For your optimization to work, it is crucial to find a keyword that is relevant to your infographic in terms of what your target audience is searching for so that it has a better chance of appearing in the SERPs.

However, make sure you choose a keyword that you are likely to rank for. It’s often difficult to rank for a generalist keyword, and it’s not likely that you’ll rank for a vague keyword like “health”.
By checking out our guide to keyword research, you’ll discover tips and tools to find a relevant keyword for your infographic that you can easily get a higher ranking for in the SERPs.
Ideally, you should find the optimization keyword before designing the infographic to make it relevant to your audience. Then you will just have to use the same keyword to optimize your infographic.
Step 2: Proceed to optimize an infographic for SEO
After you have found the perfect optimization keyword, you will use it in the best way to optimize your infographic for SEO.
This step involves performing some tasks that may seem small at first glance, but turn out to be very crucial in optimizing an infographic.
Specific places to include the keyword
To optimize an infographic for SEO properly, you need to add the keyword in some specific places.
These include:
- THE URL: You will be publishing your infographic on a web page and it must have a URL optimized with the keyword found in the first step. Search engines take this into account when ranking web pages.
However, also pay attention to the length of the URL of your infographic page when you insert a long keyword for example.
- Title: Titles are also important to optimize an infographic for SEO and you should take care to write a catchy title that clearly contains the keyword. It is also advisable to add the word “infographic” to the title.
- Meta Description: The keyword should also be added to your meta description. Be sure to write a compelling meta description that perfectly summarizes your infographic to entice people to choose your page over others.
However, the meta description cannot exceed 160 characters. Serp-simulator is a tool that will allow you to check the length of your meta description, but also your URL and title.
- H1 title: We also add the keyword in the H1 title and in the other relevant titles of your page.
- Infographic file name: The keyword should also be included in the file number of your infographic as well as information that describes the infographic itself.
This practice helps search engines understand your infographic and you increase its chances of appearing in the SERPs.
- Image alt text: Alt text lets search engines know what your infographic is about
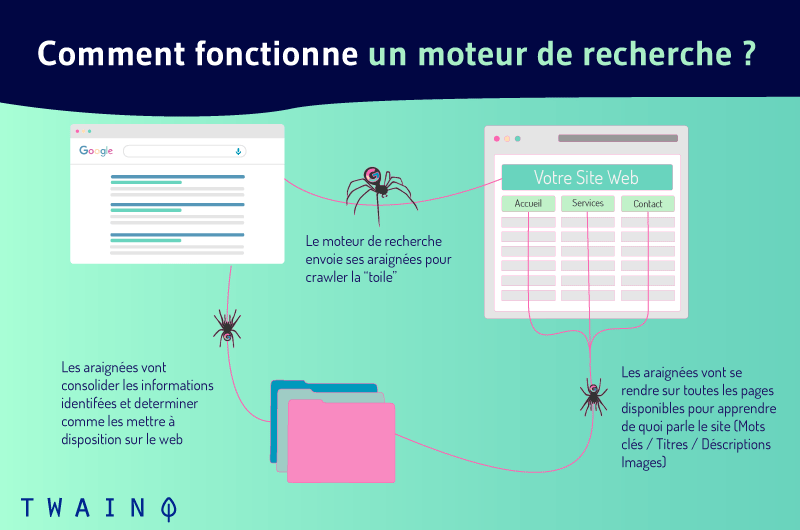
In other words, the crawlers that scan sites for content to be indexed do not read the images contained in a web page.

The alt text helps them understand what an image represents. This alt text is also displayed when an image does not load on the users screen.
If you have created an infographic about the top SEO trends in France, the alt text that describes your infographic may look like “Infographic about the top SEO trends in France.
Optimize your infographic page
As mentioned before, your infographic will be published on a web page that must also be optimized. In this section, we will discuss the different tactics to optimize this page.
Create supporting content for your infographic
Search engines love long articles and the top ranking pages in Google have an average of 2416 words. That’s why it’s necessary to write a reasonable number of words on your infographic page.
This can be an engaging introduction or an elaboration that goes deeper into the ideas discussed in your infographic.
Content creation is also a way to add value and place your keyword and similar terms strategically on your infographic page. The ideal word count to write for an infographic page is at least 1000 words.
Monitor the loading speed of the infographic page
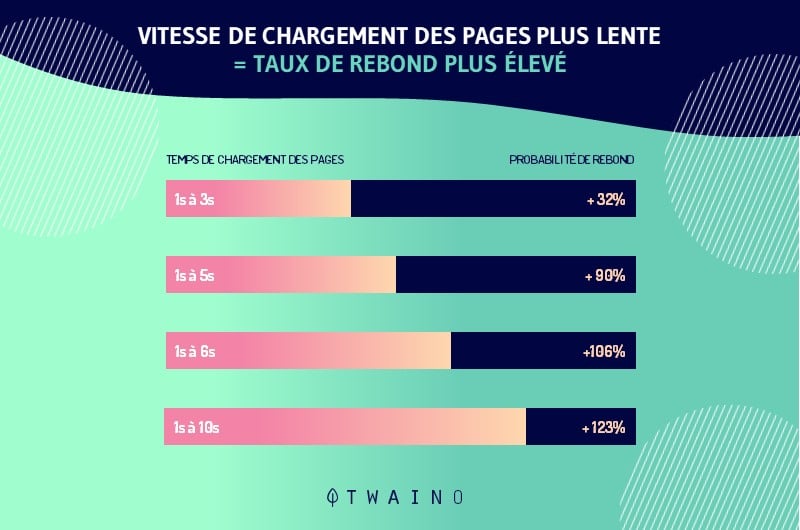
The loading speed of a web page is an important aspect that not only matters for SEO, but it also affects the user experience. This can lead to an increase in the bounce rate on your site.

That’s why you need to ensure that your infographic page loads quickly and as it should. Unfortunately, infographics are often high-resolution images and weigh a lot, making them slow to load.
The solution to this problem is to compress the file size. This way, the file size is reduced and the quality remains the same. Image Compressor is an image compression tool that you can use to resize your infographic.
Once your file is ready to be published, remember to test the upload speed. Passpreed is a free tool that will help you determine the loading speed of your page the way Google rates loading speed.
Optimize your social sharing buttons
Given the success of visual content on social media, it’s crucial to ensure that share buttons are not only available on the page, but also work and are visible.
Enabling these buttons will make it easy for users to share your infographic on social networks.
Insert visible calls to action
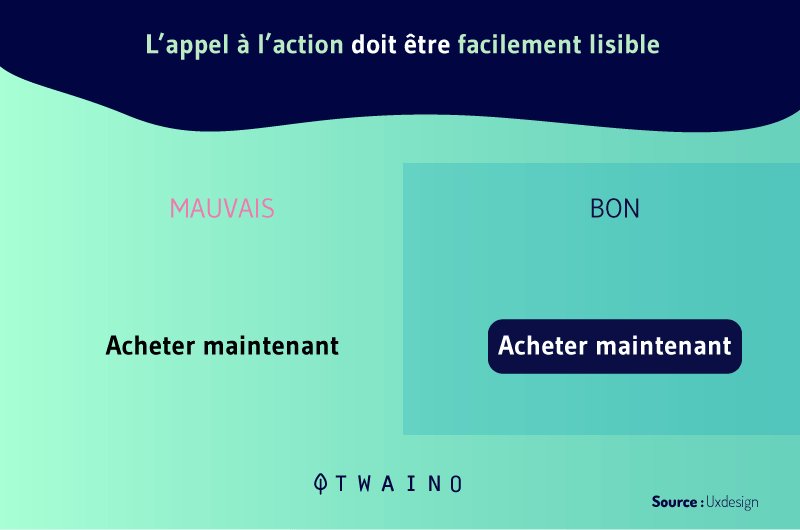
It’s fine to optimize your infographic for SEO, but it would be more beneficial to take advantage of traffic to convert visitors. By inserting a visible call to action, you make conversion easier.

The call to action encourages your visitors to take desired action whether it’s subscribing to your blog or clicking a subscribe button.
Step 3: Re-optimize underperforming content
With the tactics discussed in the previous steps, you can revisit the optimization of your old infographics that have not performed well in SEO. This will help you boost their performance to get additional traffic.
Step 4: Promote your infographic
Promoting your infographic on the right channels will help you reach a lot of readers and generate more backlinks.
By identifying the platforms and sharing your infographic on which your target audience is present, you are sure to reach the qualified people. You can also submit your infographics to infographic directories.
It is also possible to promote your infographic through the Guestography technique and generate backlinks in the process. This method consists of finding interesting sites that deal with the same topics as yours.
You will only have to present them your infographic in addition to a unique content so that they publish it and create links to your site.
To facilitate promotion, it is advisable to embed a code under your image. This way, webmasters who will share your infographic on their site are required to create backlinks to your site.
The embed code can be generated from our online tool. This infographic explains in detail how to use this image embedding tool.

Step 5: Track the performance of the infographic
The final element of optimizing an infographic for SEO is to track the performance of the infographic to draw conclusions and adjust your strategy as needed.
Tracking the success of an infographic will help you determine what type of infographic works for your audience so you know what infographic to create in the future. Analytics tools will help you know where your infographic is getting interest on the web.
Bottom line
Creating and publishing infographics is a great way to generate backlinks to a website, but is only a small part when it comes to optimizing an infographic for SEO.
Optimizing an infographic consists of:
- Identifying a relevant keyword for your infographic;
- Including that keyword in various elements such as the image file name, URL, meta description..
- Write a supporting text for your infographic;
- Promote your infographic on social media and infographic directories.
By following the different steps presented in this guide, you will be able to fully exploit the huge potential of infographics.


