Visualisation SEO

Quick Overview : Gephi
Gephi is a visualization tool with an OpenGL engine designed to help data analysts in the exploration and processing of graphics.
Videos

Gallery


Description
Gephi is a visualization tool with an OpenGL engine designed to help data analysts in the exploration and processing of graphics.
What is Gephi?
Gephi is a visualization tool developed in Java and particularly intended for data analysts. It is mainly used to visualize, explore and process graphical data.
Source: Gephi
Gephi is open-source software that works with OpenGL as its visualization engine and is compatible with Windows, Mac and Linux operating systems.
Gephi represents a great way for data analysts and scientists to further explore the science of graphs for better understanding.
We could liken it to PhotoShop, with the difference that Gephi is mainly used to manipulate graphics.
The tool was designed to help users formulate hypotheses and discover new, untapped patterns by manipulating structures, shapes and colors.
Gephi: Tool Features
comes with useful features for graph processing
Gephi
: some speed.
Source: Gephi
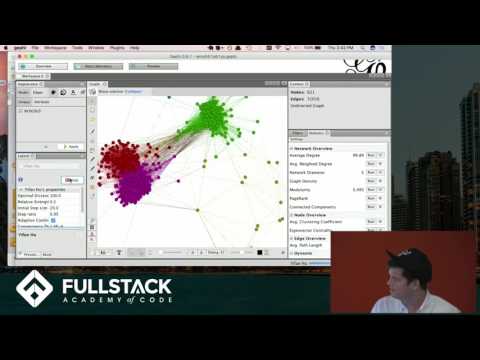
This performance of the tool is made possible thanks to the power of its OpenGL engine which guarantees better interactivity and efficiency when visualizing graphic data.
Gephi can help to:
- Quickly explore networks with up to 100,000 nodes and 1,000,000 edges
- Visualize graphs with dynamic filtering
- Access powerful tools for better manipulation of graphs
2. A “Layout” palette Layout
programs in page are essential to give form to the graphic data. Gephi has advanced layout algorithms to guarantee its users efficiency and better graphic quality.
Source: Gephi
On your Gephi interface, you have a Layout to customize the layout parameters during your graphic execution phases. This significantly improves the user experience.
3. Metrics
On your Gephi interface, you also have a Statistics and Metrics section which provides access to essential metrics for Social Network Analysis and the Scale Invariant Network.
Source: Gephi
4. Networks over time
Gephi is an innovative solution that offers dynamic analysis of your graphics. With its timeline feature, you can easily visualize how a network has evolved over time.
Source: Gephi
The tool also offers you the possibility to:
- Import a time series graph with the GEXF file
- Run metrics over time (clustering coefficient)
- Graph streaming
5. Create a cartography
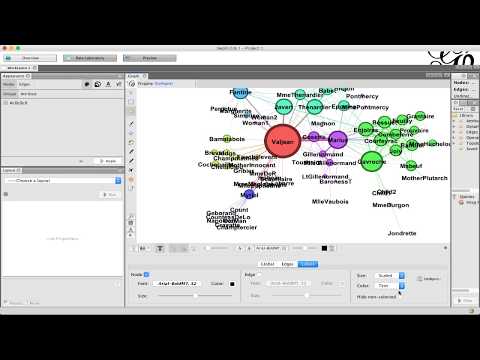
Gephi also allows you to use ranking data or partition to shape network representations.
You can do this by modifying the colors, size or labels to give shape to the network representations.
Source: Gephi
Interestingly, the tool offers vector functionality to finalize and refine the design of your creations before exporting them to SVG or PDF files.
6. A dynamic filtering
With Geph, it is possible to filter a network to choose the nodes and the sections from the architecture of the network. In addition, its intuitive user interface allows real-time dynamic filtering.
Source: Gephi
You will also be able to:
- Formulate complex filter queries without necessarily using scripts
- Build new networks from the filter result
- Save your favorite queries
7. A Data Table and Edition
Another advantage of Gephi is that the tool has a built-in Excel-like data lab for easy manipulation of columns of data.
Source: Gephi
Essentially, Gephi’s data table allows you to:
- Find and replace data
- Customize and merge columns
- Modify data in bulk
- And much more.
8. Input/Output
Gephi is also able to read most graphic file formats with the possibility of exporting to files in CSV format.
9. Gephi Plugins
Source: Gephi
Gephi also has a regularly updated library of plugins. Here you will find plugins offered by an active community of Gephi developers. These plugins are useful for extending the functionality of the tool.
Gephi: how to install the tool?
To begin with, it is important to ensure that you have the latest version of Java JRE installed on your machine. If not, download it here.
- Now navigate to the Gephi homepage and click on the “Download Now” button.
- Depending on the operating system installed on your computer (Windows, Mac or Linux), click on the version of Gephi that suits you to start the download.
- Once the download is complete, double-click on the setup to launch the installation of Gephi on your computer.
Follow the instructions to complete the installation. To do this, you just have to click on the “Next” button at each step, then on “Finish” to exit the installation wizard.
You have now successfully installed Gephi. You can then explore all the features of the tool.
Gephi: Advantages and Disadvantages
Advantages
Extremely fast tool: Gephi is equipped with an OpenGL visualization engine which gives it enough power to access very large networks with very high speed. With Gephi, you can visualize up to 1 million elements while performing all layout, filtering and data movement tasks in real time and with great fluidity.
Simple tool to install and use: Installing and using Gephi is very easy and within everyone’s reach. The tool is also appreciated for its intuitive interface with interesting features.
Modular tool : Gephi is a tool that presents several modules. The features offered are grouped into separate modules to perform a specific function. This contributes to an easy handling of the software.
Easy data import process: Gephi offers a very simple process for importing your data to CSV files.
Disadvantages
- No link between views
- Sometimes has some visual issues
- Handling of graphics can be improved.
Gephi: What you can do with the tool
Gephi can be used to:
- Analyze and explore data on networks in real time
- Represent patterns in biological data
- Create posters and present scientific achievements
- And much more
About Gephi
Grephi is a company developed by some students from the University of Technology of Compiègne in France. It was designed to facilitate the processing, exploration and manipulation of graphs and networks.
This company has created a tool that bears its name and which allows data analysts to benefit from a visualization engine in order to better understand graphs. Gephi provides algorithms to make graphics readable and convenient.
It presents other functionalities in the field of graphics processing and in the exploration of network data. We can cite:
- The analysis of social networks based ons metrics;
- The construction of new networks;
- The processing of data models;
- Importing databases;
- The creation of quality posters;
- Dynamic chart analysis.