Short description : Site Performance
WebPageTest: Find out how to test the performance of your website with this free online tool.
Long Description : Site Performance
Description WebPageTest
WebPageTest is a free platform designed primarily to help developers test the performance of the websites they are responsible for.What is WebPageTest?
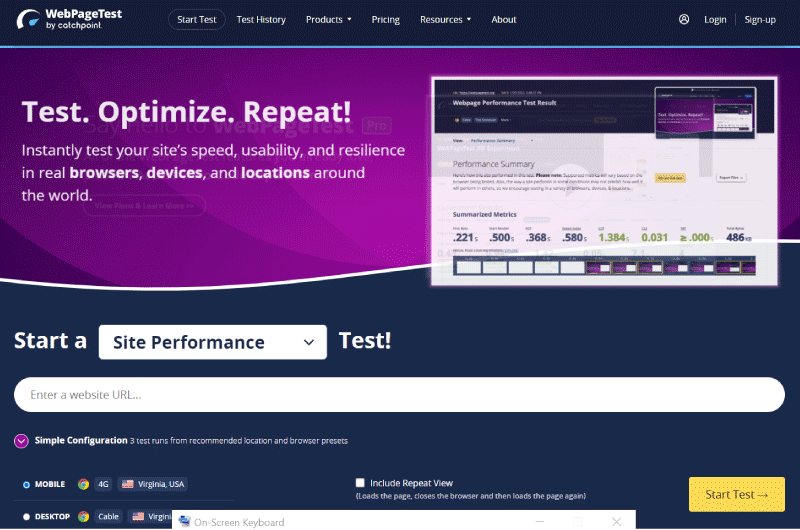
Recently redesigned, WebPageTest is a platform with several very practical features to effectively test the performance of a website. WebPageTest also receives very good and quite laudatory comments. The platform is often considered the best in terms of features and options for testing a website. One of the popular features on WebPageTest is the ability to run performance tests from multiple geographies using real browsers with real connection throughput. Unlike the scores offered by other tools to evaluate the performance of a website, this feature of WebPageTest allows you to test your site using the position of your users exactly as if you were there. You could then get a concrete snapshot of loading speed, exactly as it appears on your users’ devices, with actual location and connection. WebPageTest also allows you to perform other types of tests, including simple and advanced tests, Total Blocking time (TBT), traceroute tests, Core Web Vitals, multisite visual comparisons and many others.WebPageTest: How to use the tool?
- To get started, go to the WebPageTest homepage and enter the URL of the page you want to test.
- But you can also scroll down the list of options and choose the type of test that suits you between Core Web Vitals, Lighthouse, Visual Comparison or Traceroute.
1. Defining the test parameters
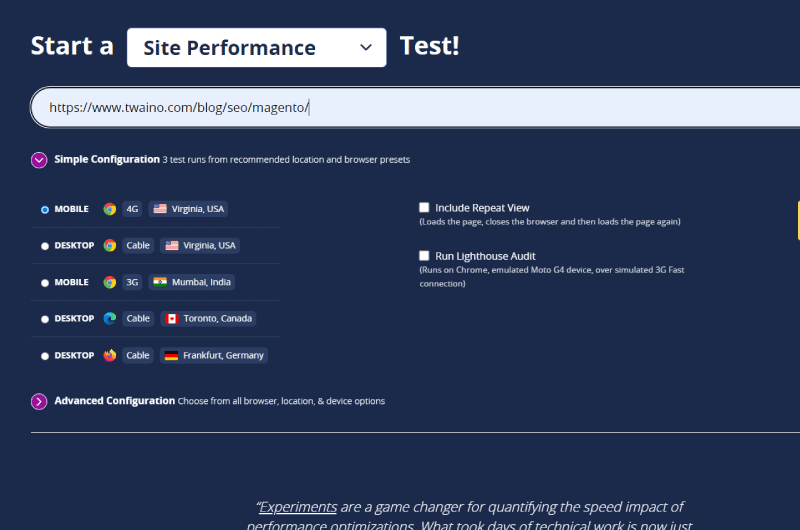
WebPageTest offers two types of parameters to perform your tests, simple and advanced.The simple configuration
The parameters of a simplified configuration on WebPageTest are very easy to set up: You simply choose a desktop or mobile configuration with a 3G, 4G or cable connection. By default, the platform chooses a 4G Mobile configuration emulated in the United States from Virginia.- Once the connection and type of connection have been chosen, you can check the boxes:
- “Include the repeating view”
- and “ Run a Lighthouse audit ”.
Advanced Configuration
When it comes to advanced configuration, WebPageTest offers a plethora of options worth exploring. This makes the platform a powerful tool suitable for developers. But even for a beginner, there are some easy-to-set options (missing in the simple setup) that can be very handy.- To get started, click on “Advanced Setup” to drop down the section and access the available options.
- To get more options, you can switch to the other tabs and further specify your configuration criteria.
- Click on the “Launch test” button to start processing your request.
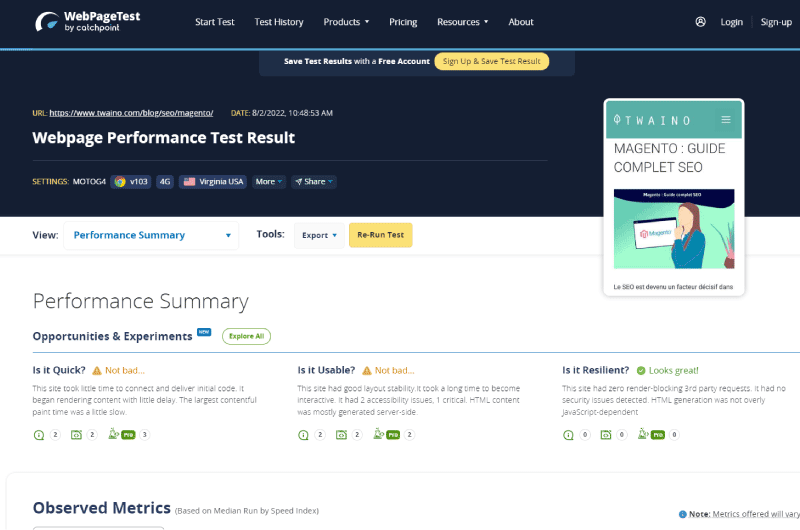
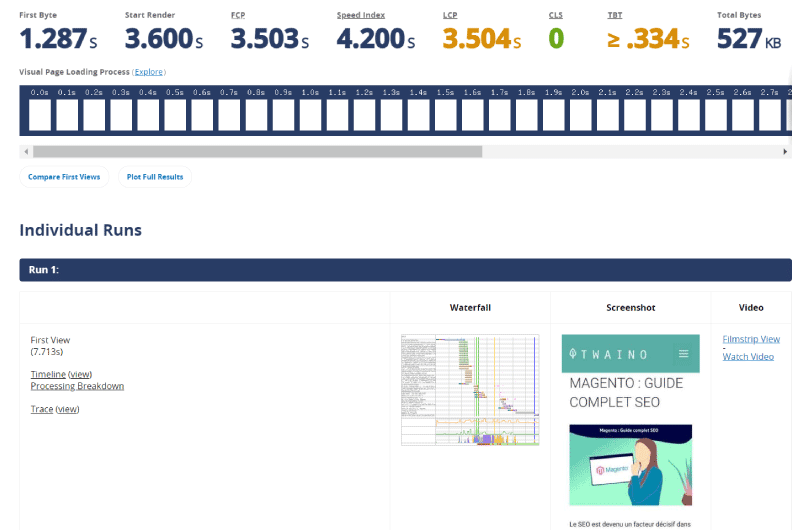
2. Get a performance overview
Once processing is complete, WebPageTest displays a site performance overview with information about:- All analyzed metrics
- First byte
- load time Total load time
- Number Total Bytes
- And other Real User Monitoring (RUM) metrics such as First Contentful Paint and Time to First Byte.
- Click on the “Performance Summary” field to drop down the list of tabs that we will now present one by one:
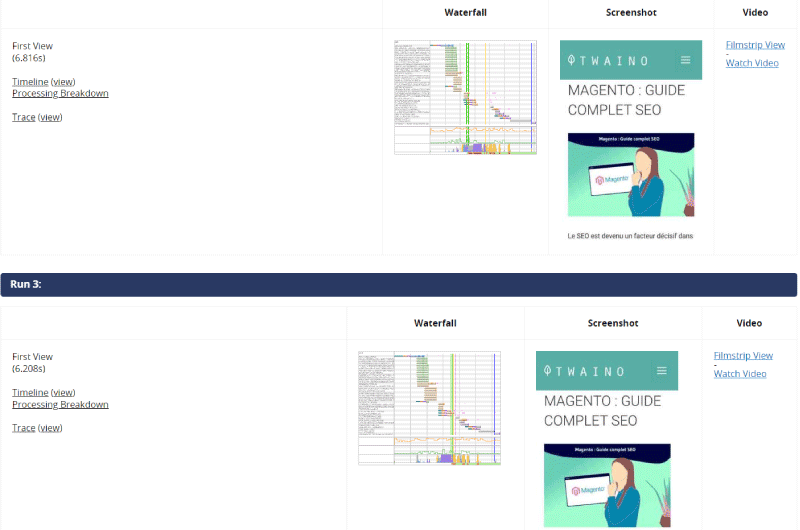
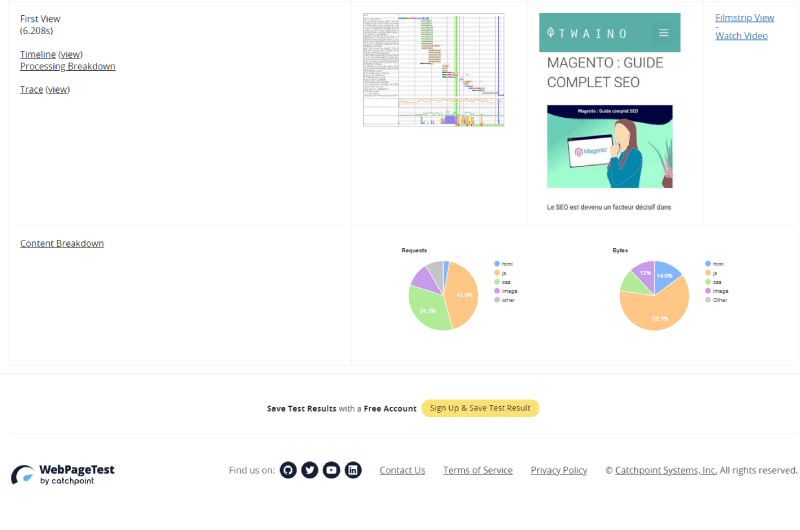
Filmstrip
As the name suggests, this tab presents a filmstrip view of your site’s load time. On each image present on the filmstrip, you have the waiting time necessary for Internet users to obtain it on their screen and the percentage of loading that the image represents on the complete display of the website.- As you scroll through the filmstrip, you have a red marker indicating your position on a waterfall chart.
Requests details
Compared to the previous one, the “Requests Details” tab is a bit more technical. As the platform says, “this page can be used to explore metric timings and request a cascade for any run of your test.” The “Details” tab has 6 parts namely:- Observed
- Metrics Actual User Metrics
- Waterfall
- View Connection View
- Request Details Request
- Header.
Web Vitals
In this tab, you have the results on Core Web Vitals, a series of metrics initiated by Google with the aim of improving loading speed and user experience (UX) on websites.Optimization
On the “Optimization” page you again have an alphabetical score like the one shown at the very beginning of the WebPageTest report, but here an individual score is assigned to each important metric. By clicking on a score, you can access more details about the metric concerned.Content
The “Content” tab provides information on how the resources of the analyzed site are composed by type of content.Domains
On this page, you have a distribution of content by domain. Depending on the site architecture, the tab can display one or more domains. And looking closely at the pie chart, we can see that a percentage of queries and content come from Google Analytics and Google Tag Manager.Processing
Here you have a processing breakdown that shows:- The different processing categories
- The processing events
- And the page load percentages.
Additional options
After the “Processing” tab, you have 4 external links that refer to more advanced analyses. These are the options:- Image Analysis
- Map Request
- Data Cost
- Safety
Score: Key Tool Features
- Identify First Byte Load Time
- Discover Your Website’s Core Web Vitals Metrics
- Discover the Total Blocking Time (TBT) of any web page
- Identify the total size of a web page
- Discover the speed index of a website
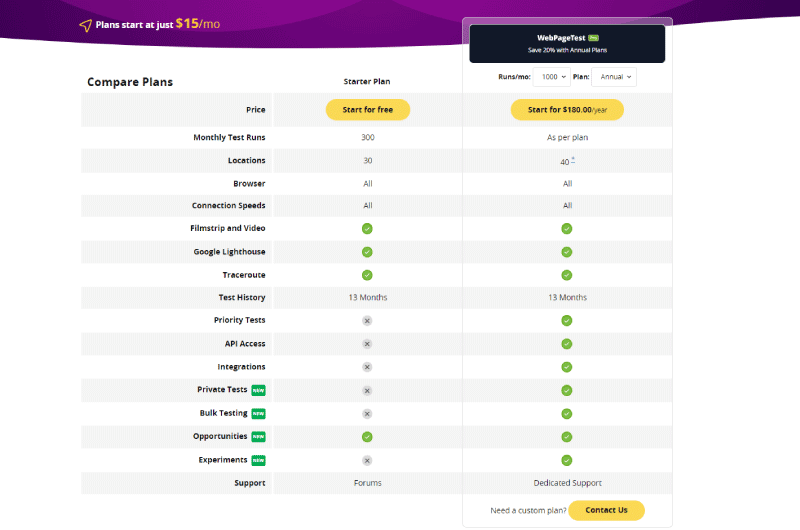
WebPageTest: Pricing
Tests with WebPageTest are available for free, but the platform also offers Pricing plans start at $15 per month to access more features. Click here to learn more.WebPageTest is also other functionalities via API integrations
When you search for WebPageTest on Google, the first result is probably the link webpagetest.org which leads to the platform that we have just presented in this guide. But WebPageTest is also other features to discover more via API integrations. These APIs allow you to obtain very detailed analyzes on the performance of your website.Website Speed Test : Another version of WebPageTest in collaboration with Cloudinary
Website Speed Test is the result of the collaboration between webpagetest.org and Cloudinary who came together to create an image analysis and website speed test tool, capable of analyzing content, the format and size of each image present on a URL. The tool allows you to analyze your images and obtain optimization recommendations to improve the performance of your site.Videos : Site Performance
Images : Site Performance
Company : Site Performance
WebPageTest is a tool owned by Catchpoint since September 2020. Catchpoint’s mission is to improve the Internet by continually innovating the way businesses and IT use data to enable those businesses to be successful in their sector of activity.
To do this, they developed the WebPageTest SEO tool. The tool lets you automatically test your site for speed, smoothness, and compatibility across browsers, devices, and global locations.
The tool also allows you to have information on the user experience. In other words, you understand with WebPageTest what your site visitors experience once on your web pages.
To this extent, the tool is aimed at digital marketing experts, web agencies as well as SEO specialists.
Contact : Site Performance
- Site Performance
- Check the Corporate Website
Social Media : Site Performance
Others Tools : Site Performance


 Alexandre MAROTEL
Founder of the SEO agency Twaino, Alexandre Marotel is passionate about SEO and generating traffic on the internet. He is the author of numerous publications, and has a Youtube channel which aims to help entrepreneurs create their websites and be better referenced in Google.
Others SEO Tools
All SEO Tools
Sorry, no content found.